Saturday, July 15, 2006

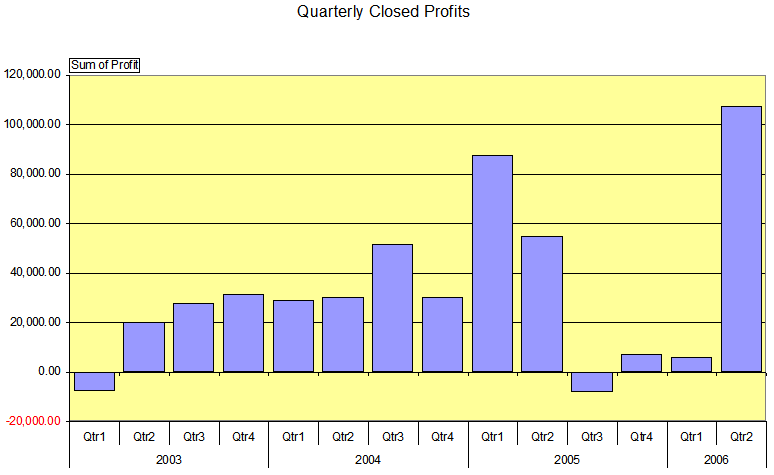
Quarterly Performance - Q2 2006


The market downturn in May/June 2006 saw substantial open profits realised. It wasn't a bad financial year, although I am sitting on a bit of cash at the moment waiting for some entry signals. I did get some buy signals that I acted on in early July - BPT and HGI - although the market doesn't inspire confidence at the moment.

Stevo

Thursday, June 22, 2006

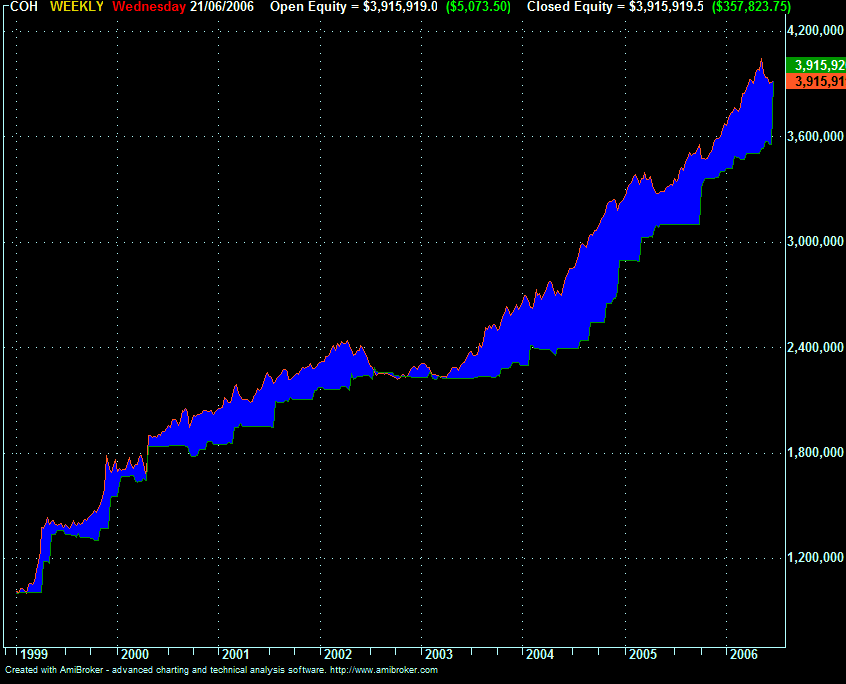
Closed Equity chart


Closed equity chart for AmiBroker. I got the code from;
http://lightning.he.net/cgi-bin/suid/~reefcap/ultimatebb.cgi?ubb=get_topic;f=49;t=000139;p=1

It's nice to see the closed and open equity on the one chart.

regards
Steve

Saturday, May 20, 2006

A couple more trades


Interesting week.

It's good to realise that profits in open trades really need to be discounted - they aren't real until the trade is finished. SGX realised 82%, SRL 24%.

Friday, April 14, 2006

SKE trade


Recent SKE trade. I ignored the profit exit signalled over christmas due to light volume and let it run until the exit signalled this week. I've tested not taking the profit exits and it doesn't matter if I ignore them occasionally. Got out on the close this week. Nothing startling at 28% but also nothing to complain about.

Tuesday, April 11, 2006

Trading Performance & MSA software

I imported all my trades from January 2003 to Q1 2006 into Market System Analyzer software from Adaptrade (www.adaptrade.com) and got the following results;


Not a bad time to be trading.

Saturday, April 01, 2006

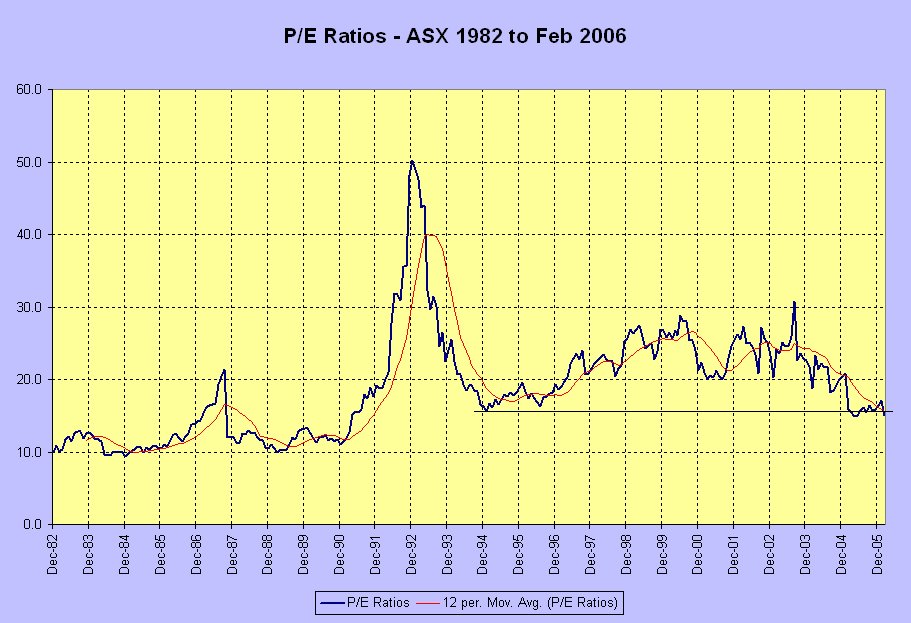
P/E ratios on the ASX


P/E ratios suggest that the market is actually quite cheap, even though the market is hitting new highs. Data is up to the end of February 2006. We haven't seen P/E's this low since the early 90's.

Data from http://www.rba.gov.au/Statistics/AlphaListing/alpha_listing_s.html - you can download the spreadsheet for Sharemarkets.

Stevo

Quarterly Performance - Q1 2006


Quarterly performance of my long term trading portfolio - excluding dividends. Most of the profits shown in the last quarter haven't been realised. Realised profits for the current financial year are $7,727, less than half the dividend payments so far received, whilst the portfolio is currently sitting on $185,000 of unrealised gains, up over $100,000 since the last quarter.

Stevo

Saturday, March 25, 2006

Comparing systems using Monte Carlo tests


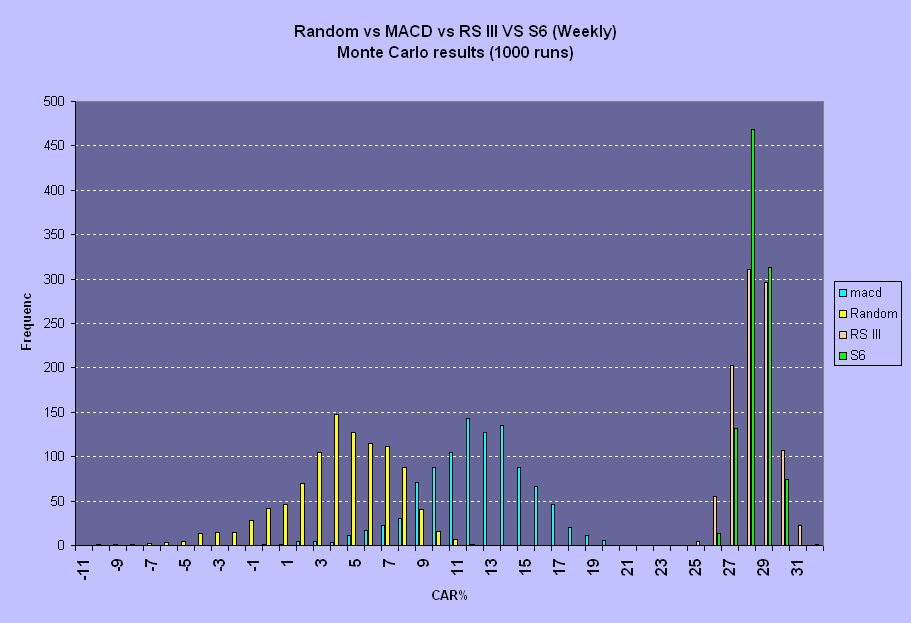
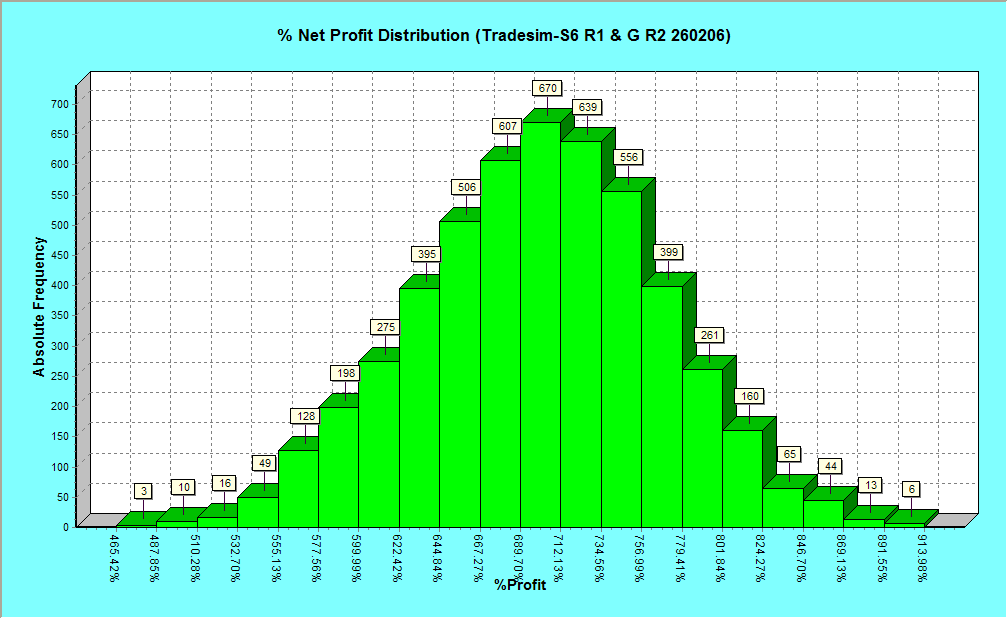
The chart shown compares 4 different systems using Monte Carlo analysis. 4 systems are compared - random buy and sell, weekly MACD and 2 of my own systems. The distributions show the possible range of outcomes for each system, as tested by a 1000 run Monte Carlo test.

Even random buying and selling would probably have made some money, although it's not guaranteed. MACD is also pretty average.

Different position sizing strategies have an impact on returns and I can boost returns considerably in a test run by changing position sizing strategies. I used a conservative $10,000 a trade on $100,000 for these tests, with a maximum of 11 positions.

Steve

Tuesday, March 14, 2006

A few nice trades


ASX triggered an exit a couple of weeks back, as did RCD. Two trades with two different methods. The system used for RCD was developed using IO and Amibroker and uses a profit target but only trades the top 200 stocks, with a focus on the top 100.

The ASX trade is with a system I have been using for a few years and has a trailing exit point. Note the green and red bar along the bottom of the chart - it gives an indication of current market conditions. When the bar is red buy signals are turned off.

HIG also triggered an exit and made a small profit.

Sunday, February 26, 2006

Combining Systems


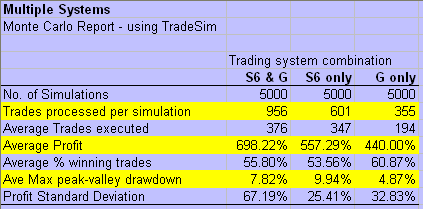
I combined 2 systems together and simulated trading using the same position sizing and capital bases for both systems from 1999 to 2006.

The results are shown in the chart posted.

Performance for profit was improved when the systems were traded together, and drawdown was better than just trading the most profitable single system. More trading opportunities provided greater profits but did not increase drawdown in proportion to the profits.