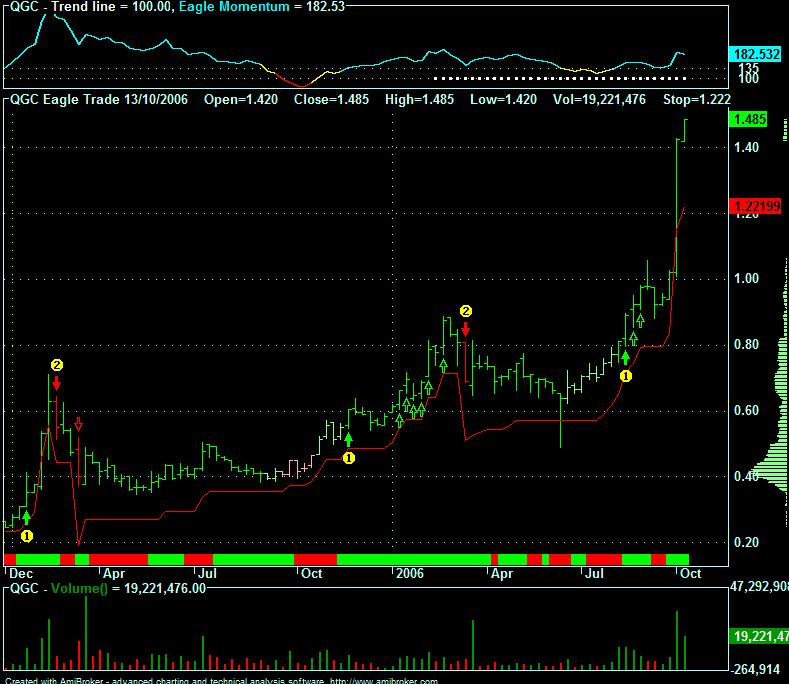
I am not a great fan of lots of indicators or the way that they are often used. The QGC chart above (one of my current trades) shows the following indicators;
1. Price,
2. a momentum indicator in the top window,
3. Volume in the bottom window,
4. Trailing stop - red line.
5. Index trend - red / green ribbon in the chart.
Price, which is an important indicator, tells us how much was paid for a stock in the past. Momentum, for me, is a strength indicator - how fast is the stock moving? Volume obviously tells us how much interest there is in a stock and the trailing stop tells me when to get out.
These indicators can all be combined to give a mechanical signal to buy and sell stock. Price is useful, but so is momentum, volume and the trailing stop. They all work together to produce a system. I could not trade by the price plot alone.
I don't use overbought / oversold indicators and I don't look for divergences - too subjective. If it's not going up it's not going up and divergences aren't going to convince me otherwise. I am not interested in knowing that a stock might change direction!
SO looking at the QGC chart above what got me into the trade before the takeover was announced? Volume, price and momentum are both heading up together.
Stevo