Saturday, March 25, 2006

Comparing systems using Monte Carlo tests


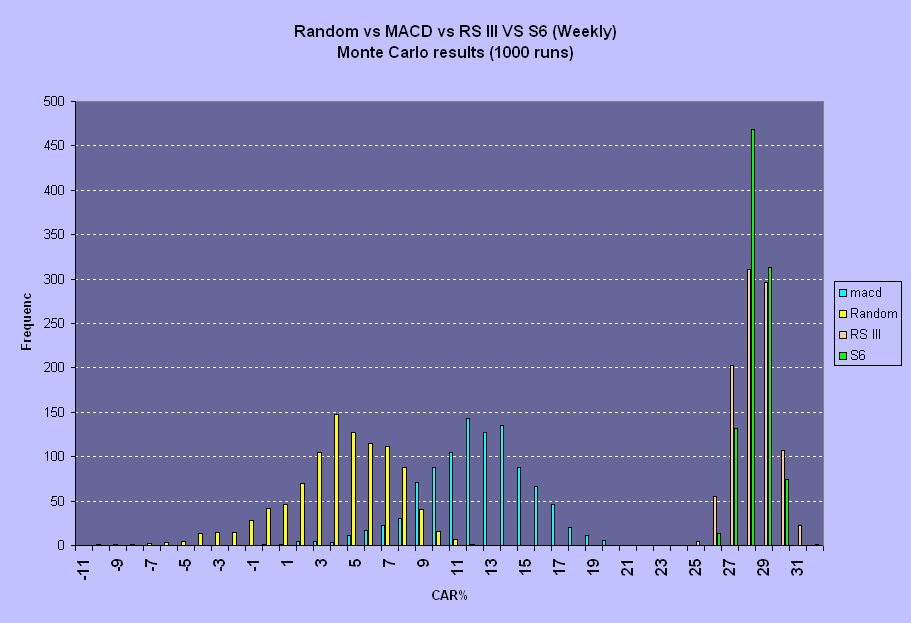
The chart shown compares 4 different systems using Monte Carlo analysis. 4 systems are compared - random buy and sell, weekly MACD and 2 of my own systems. The distributions show the possible range of outcomes for each system, as tested by a 1000 run Monte Carlo test.

Even random buying and selling would probably have made some money, although it's not guaranteed. MACD is also pretty average.

Different position sizing strategies have an impact on returns and I can boost returns considerably in a test run by changing position sizing strategies. I used a conservative $10,000 a trade on $100,000 for these tests, with a maximum of 11 positions.

Steve

Tuesday, March 14, 2006

A few nice trades


ASX triggered an exit a couple of weeks back, as did RCD. Two trades with two different methods. The system used for RCD was developed using IO and Amibroker and uses a profit target but only trades the top 200 stocks, with a focus on the top 100.

The ASX trade is with a system I have been using for a few years and has a trailing exit point. Note the green and red bar along the bottom of the chart - it gives an indication of current market conditions. When the bar is red buy signals are turned off.

HIG also triggered an exit and made a small profit.