Saturday, December 30, 2006

Revised Yearly results


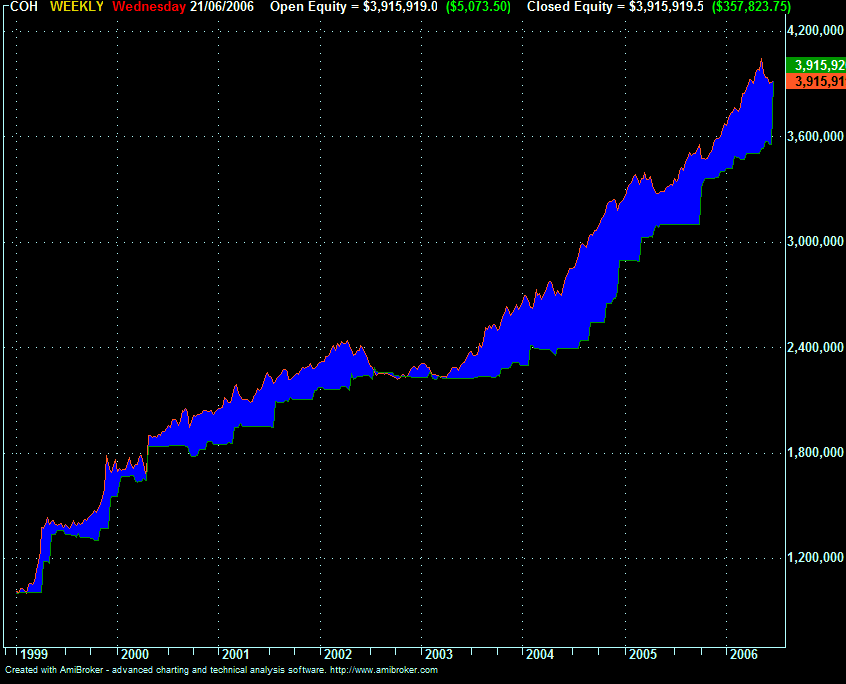
 Below I posted early 2006 results. I revised the charts above give a better picture. The last bar shows carried forward open trades. Even though 2006 could be considered down on previous years in terms of realised profits the open profits carried forward into 2007 gives a better idea of how good 2006 was. Profit factor is still over 3 at 3.34, including open trades.

Over the last year there has been quite a distinct accumulation / distribution pattern of profit taking. So the 2nd quarter of 2006 realised substantial profits. Profits have been building through the 2nd half of 2006. 

Don't ask me for % profits over the year. I added substantial capital late this year.

Let's see what 2007 brings.

Thursday, December 28, 2006

Time Frames


Time frame can be quite misleading - the chart above could easily be daily.

The chart above shows signals from a system I have been working on. I have stated I am a longer term trader - the chart shows monthly bars. What is surprising is that, as long as I can get in/out around the open of the following month, the system drawdown is quite low. If I use a random entry / exit price (as opposed to the open price) in the following month drawdown increases, but the results are still good enough to encourage me to make some trades using a monthly timeframe.

The system does use stochastics, as well as index filters, volume and a momentum indictator. Above 50 on the stochastic sets up a buy, below 50 triggers a sell. Stochastics, combined with RSI in a monthly timeframe can work quite well, although I am not using RSI in this system. But not in the traditional sense.

The bar colours are set by the stochastic to show the trend.

Stevo

Tuesday, December 26, 2006

Early 2006 performance


2006 was a good year, although I am jumping the gun a little since it is not quite over. 

Open and closed profits realised over $260,000, plus some dividends and bank interest. 
However $170,000 is in unrealised profits and will be carried forward into next year.

Realised profits were down over previous years, but nothing of concern considering the level of open profits moving into next year. A good year could easily be one where there are no realised profits because no sell signals are given and open profits are growing.

I made a slight loss in the last quarter, but adding an extra $800,000 to the portfolio is doing reasonably well, aided by the excellent market conditions.

Wishing all a merry Christmas and a happy New Year.
Stevo 

Friday, December 01, 2006

Bollinger bands


The chart above shows a nice bollinger band breakout on a weekly ERG chart. I am not in this trade and this is not an active system. I find this a more fruitful aproach than the traditional OB/ OS strategy commonly touted in trading books. I use this strategy to trigger buys in systems I trade. Combined with volume, momentum and a suitable exit it works quite well.

To quote from the Bollinger site;
"Price can, and does, walk up the upper Bollinger Band and down the lower Bollinger Band."

"Closes outside the Bollinger Bands can be continuation signals, not reversal signals--as is demonstrated by the use of Bollinger Bands in some very successful volatility-breakout systems."


Stevo


Sunday, November 26, 2006

% Profit frequency chart


% Profit frequency chart for 129 trades to compare with the dollar frequency chart below. On startup of the system I was a little cautious in terms of position size so the % profits were not matched by the dollar profits!
Stevo

Saturday, November 25, 2006

Trading profit & loss - frequency of profits & losses


The chart shows the frequency of trade returns in dollars for my portfolio. There are a total of 129 trades in the results. Looking at the chart 38 trades lost between $0 and $5000. 58 trades lost money out of the 129. The results are based on portfolio status up to the end of October.
One trade lost more than $15,000 - a lesson about trading whilst on holidays and double checking everything. I got the position sizing very wrong with this losing trade and suffered more than double the loss I should have. If you trade more than one portfolio make sure you don't place an order in the wrong portfolio. Overall though the chart is nicely skewed in my favour.
HumbleMoney inspired this post http://www.humblemoney.com/?p=140
Stevo

Monday, November 20, 2006

One step forward and two steps back - the Market Tango

As usual when one puts more money in the market the market reminds me that it's not that easy. Both SRL and CEY are recent trades.


These 2 weren't too bad but the following one was unfortunate!

Resource stocks tend to move as one with commodity prices, although I like them in a portfolio as they can make substantial gains. One winner and 2 losers.

Stevo

Monday, November 13, 2006

JBH trade


This was a nice trade for the super fund. I exited 2 weeks back. When I buy the exit targets are set as shown by the upper and lower lines. I also use a lazy moving average. I only exit on the close which is why the system didn't exit earlier.

The system is designed for the ASX100 / ASX200 and whilst it doesn't give the sorts of returns as some other systems it is a nice system to trade. This trade returned around 43% plus dividends.

Stevo

Saturday, November 11, 2006

Trade Equity


I love the power of Pivot Tables in Excel. They allow me to extract all sorts of info out of StockMaster (the software I use to manage my portfolio). I often use more than one order to buy the number of stocks I need for a postion. By using Excel I can amalgamate the multiple orders using Pivot Tables to get the graph up to the end of October 2006. I have made 129 trades in this portfolio since Jan 2003. The last stocks on the graph are open positions and the R squared value is shown just because I can.

Obviously there are peaks, troughs and the odd flat period on the chart, but overall the direction, in a bull market, is in the right direction. As always I can only take what the market gives - and so far it is in a very giving mood.

The Aussie stock market is booming. Resource stocks are leading the way yet again and it looks like being a good year again. I have also just put another $800,000 trading capital into this portfolio.

Stevo

Monday, October 16, 2006

Indicators


I am not a great fan of lots of indicators or the way that they are often used. The QGC chart above (one of my current trades) shows the following indicators;
1. Price,
2. a momentum indicator in the top window,
3. Volume in the bottom window,
4. Trailing stop - red line.
5. Index trend - red / green ribbon in the chart.

Price, which is an important indicator, tells us how much was paid for a stock in the past. Momentum, for me, is a strength indicator - how fast is the stock moving? Volume obviously tells us how much interest there is in a stock and the trailing stop tells me when to get out.

These indicators can all be combined to give a mechanical signal to buy and sell stock. Price is useful, but so is momentum, volume and the trailing stop. They all work together to produce a system. I could not trade by the price plot alone.

I don't use overbought / oversold indicators and I don't look for divergences - too subjective. If it's not going up it's not going up and divergences aren't going to convince me otherwise. I am not interested in knowing that a stock might change direction!

SO looking at the QGC chart above what got me into the trade before the takeover was announced? Volume, price and momentum are both heading up together.

Stevo

Friday, October 13, 2006

Average trade length and performance


I have been reporting results quarterly but the average hold time is in excess of 6 months, with winners often exceeding 1 year. So reporting quarterly results is quite lumpy. The chart below is a yearly chart which shows quite consistent performance.

This portfolio was fortunate enough to hold QGC (currently subject to a hostile takeover from Santos) and results since the last quarter (sept 2006) have jumped nicely. This portfolio currently has over $80,000 profit in open trades.

Stevo

Wednesday, October 04, 2006

3rd Quarter 2006


The systems are ticking along nicely. There was a small realised loss for the quarter. The last bar consists of open profits in the portfolio carried forward to the 4th quarter.

I am still trading with around $400,000 capital - the capital base moves around a bit. Cost price of the portfolio was $338,542 and the market value at the end of the quarter was 393,591. I have a bit of cash on hand for some forthcoming house expenses.

The chart shows only capital gains and does not include dividends.

Stevo

Saturday, July 15, 2006

Quarterly Performance - Q2 2006


The market downturn in May/June 2006 saw substantial open profits realised. It wasn't a bad financial year, although I am sitting on a bit of cash at the moment waiting for some entry signals. I did get some buy signals that I acted on in early July - BPT and HGI - although the market doesn't inspire confidence at the moment.

Stevo

Thursday, June 22, 2006

Closed Equity chart


Closed equity chart for AmiBroker. I got the code from;
http://lightning.he.net/cgi-bin/suid/~reefcap/ultimatebb.cgi?ubb=get_topic;f=49;t=000139;p=1

It's nice to see the closed and open equity on the one chart.

regards
Steve

Saturday, May 20, 2006

A couple more trades


Interesting week.

It's good to realise that profits in open trades really need to be discounted - they aren't real until the trade is finished. SGX realised 82%, SRL 24%.

Friday, April 14, 2006

SKE trade


Recent SKE trade. I ignored the profit exit signalled over christmas due to light volume and let it run until the exit signalled this week. I've tested not taking the profit exits and it doesn't matter if I ignore them occasionally. Got out on the close this week. Nothing startling at 28% but also nothing to complain about.

Tuesday, April 11, 2006

Trading Performance & MSA software

I imported all my trades from January 2003 to Q1 2006 into Market System Analyzer software from Adaptrade (www.adaptrade.com) and got the following results;


Not a bad time to be trading.

Saturday, April 01, 2006

P/E ratios on the ASX


P/E ratios suggest that the market is actually quite cheap, even though the market is hitting new highs. Data is up to the end of February 2006. We haven't seen P/E's this low since the early 90's.

Data from http://www.rba.gov.au/Statistics/AlphaListing/alpha_listing_s.html - you can download the spreadsheet for Sharemarkets.

Stevo

Quarterly Performance - Q1 2006


Quarterly performance of my long term trading portfolio - excluding dividends. Most of the profits shown in the last quarter haven't been realised. Realised profits for the current financial year are $7,727, less than half the dividend payments so far received, whilst the portfolio is currently sitting on $185,000 of unrealised gains, up over $100,000 since the last quarter.

Stevo

Saturday, March 25, 2006

Comparing systems using Monte Carlo tests


The chart shown compares 4 different systems using Monte Carlo analysis. 4 systems are compared - random buy and sell, weekly MACD and 2 of my own systems. The distributions show the possible range of outcomes for each system, as tested by a 1000 run Monte Carlo test.

Even random buying and selling would probably have made some money, although it's not guaranteed. MACD is also pretty average.

Different position sizing strategies have an impact on returns and I can boost returns considerably in a test run by changing position sizing strategies. I used a conservative $10,000 a trade on $100,000 for these tests, with a maximum of 11 positions.

Steve

Tuesday, March 14, 2006

A few nice trades


ASX triggered an exit a couple of weeks back, as did RCD. Two trades with two different methods. The system used for RCD was developed using IO and Amibroker and uses a profit target but only trades the top 200 stocks, with a focus on the top 100.

The ASX trade is with a system I have been using for a few years and has a trailing exit point. Note the green and red bar along the bottom of the chart - it gives an indication of current market conditions. When the bar is red buy signals are turned off.

HIG also triggered an exit and made a small profit.

Sunday, February 26, 2006

Combining Systems


I combined 2 systems together and simulated trading using the same position sizing and capital bases for both systems from 1999 to 2006.

The results are shown in the chart posted.

Performance for profit was improved when the systems were traded together, and drawdown was better than just trading the most profitable single system. More trading opportunities provided greater profits but did not increase drawdown in proportion to the profits.

Monday, February 20, 2006

System tests - Monte Carlo


What looks like two very different systems are actually the same system with different position sizing strategies. The 2000% plus profit for system 1 was achieved using 10% of equity as the postion size, whilst system 2 used $10000 per trade on $100,000. Everything else in the 2 tests was the same.

This is why it can be very difficult to compare systems.

The results are from a 100 simulation Monte Carlo, from Jan 1999 to present, on the ASX300. As with all my systems this one is weekly. Average trade length is over 1 year. I don't trade this system.

Saturday, February 11, 2006

DOM again


The DOM trade below uses an ATR trailing exit. I have been working on a system with an MA exit, as well as an rarely triggered RSI overbought exit, and a 200% gain exit. It would have worked well on DOM, and who would complain about a 200% gain?

Friday, February 10, 2006

DOM trade


I exited DOM just before the close at $1.195. It was a pretty volatile trade in the last week, but it made just under 50% so I can't really complain.

Sunday, January 01, 2006

NRT- weekly chart


I tend to post the more impressive trades, rather than the losers. Often the losses are quite small and don't bother me, it's just part of trading. So I thought that I would post a potential loser - NRT. I haven't got a sell on it yet but it has come very close. It's been consolidating around the $5 mark for nearly 2 years. This system picked it up with a breakout 6 weeks ago, probably on some good news. This one is in my SMSF and not part of the quarterly results shown below.

Also the quarterly results below only show capital gains and losses. Dividends and any bank interest are not included.

2003 to 2005


Someone said that they preferred charts to pictures. Average capital in the market from 2003 to 2005, based an end of quarter snapshot, was $424,000. Note the unrealised profits. I haven't sold too many winners in the last 2 quarters, which is the way I like it.