Sunday, August 28, 2005

Monte Carlo with AB


I have been doing a bit of work on my spreadsheet to analyse Monte Carlo runs in AmiBroker. The screenshot shows my Graphs page.

I just do a dummy optimise in AB dump the portfolio summary into Excel and everything else is pretty much automatic. This one has 500 iterations.

I'm off to Portugal on Wednesday and probably won't post anything here for at least 3 weeks.

regards
Steve

Monday, August 22, 2005

Spirit of Ecstacy. Not my Roller though.

Posted by Picasa

Random entry

Try again - this chart is with a random entry.

Random entries and exits

The hypothesis is that entry criteria is irrelevant - that you could just buy at random and get just as good a result as an entry criteria that looks for some pattern.

I did some testing and found quite the opposite. Compound annual return for stocks using random entry and random exits are plotted below;


The results show that the random exit system outperformed the random entry system with the MA stop in terms of compound annual return. A random exit is really like a variable timed stop.

Sunday, August 14, 2005

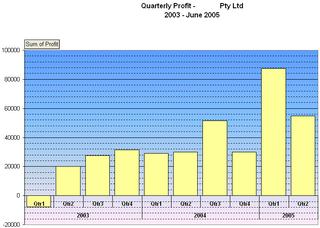
Quarterly returns


Above results are closed trade profits from trading mechanical systems on ASX stocks. I'm just practising on roughly $0.5 million before I get into serious trading :), although I keep spending the profits! Mechanical long term systems take time to build profits, I'm not looking at fast bucks, just steady consistent dollars.

Stevo

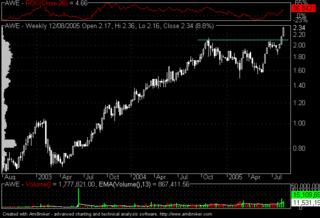
AWE


AWE also came up with a buy in one of my systems. I'm actually practising posting images on this site! They are a bit fuzzy at the moment. I was using Opera to post images and it didn't work so I'm back to IE.
Here's a more traditional view for the chartists.

Posted by Picasa

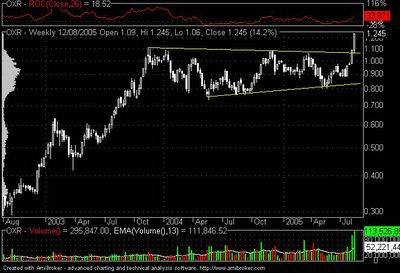
OXR for the more traditional chartists

It looks good - breakout on volume.
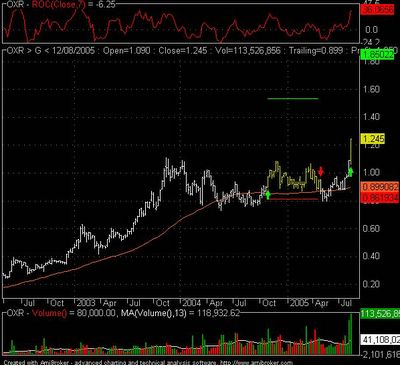
Lots of buy signals this weekend - More signals than cash. A preliminary look suggests OXR for starters using "G". I will have a look at the fundamentals of some of the candidates before making a decision. No sells for the week.

Posted by Picasa

Wednesday, August 10, 2005

WPL using "G" - this one I do hold. The system draws 2 exit points on entry - the red lower line is the loss target and the upper green line is the profit target. This one needs a weekly close above $34.44 to trigger an exit. An MA trailing exit point (orange line) completes the picture. It looks promising at the moment but who knows if it will hit it's profit target!

Posted by Picasa

Saturday, August 06, 2005

ALN using a weekly system I developed using IO called Channel G. Admittedly a well chosen example - the exit in early 2004 was pure fluke! Also I did not make these trades as the system is only a few months old. I have a few trades running using this system - WPL, JHX, MAY and LHG from memory.

Posted by Picasa